mHealthData - Wearable health data to NumPy
Motivation
Wearable devices are best fit to continuously monitor physiological parameters and provide unique means to measure recovery ability due to their high sampling rate.
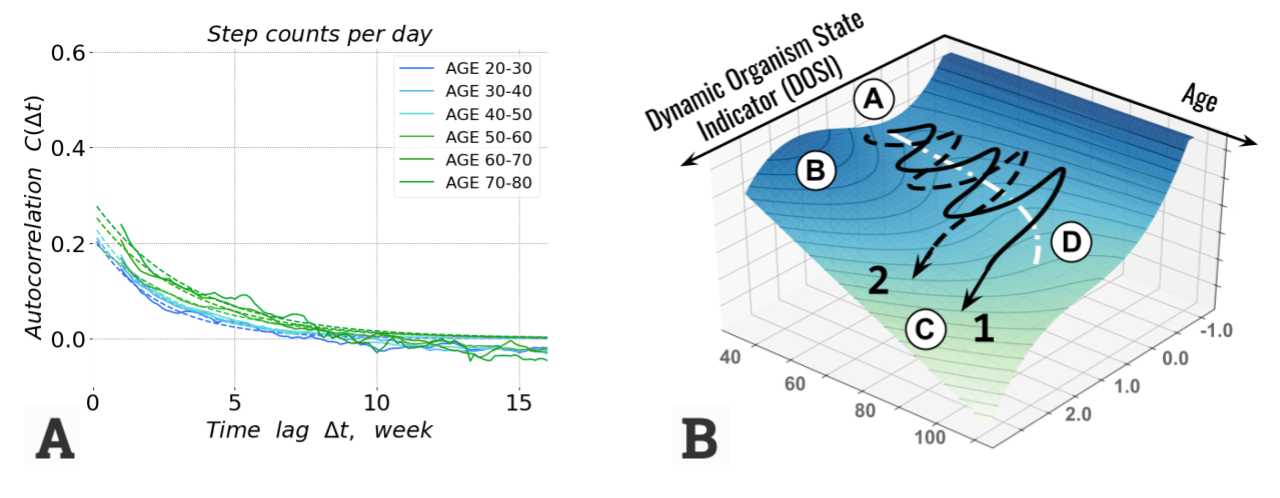
For example, a study Pyrkov T.V. et al., Nat Comms 12, 2765 (2021) found an age-related decline in recovery rate (A) based on analysis of blood samples and physical activity measured by consumer-grade wearable devices. The loss of dynamic stability schematically shown in (B) may provide an explanation to the age-related growth of morbidity and mortality rates.
mHealthData is a tool to convert various data formats of smartphone health apps to NumPy arrays to facilitate data analysis and research.
Features
Read health data export of
Fitbit,Samsung Health, andApple HealthkitRead all
.xml,.csv,.jsonto pandas DataframeFix time zone inconsistency and convert to local time
Device-centric approach - output numpy arrays for selected wearable devices
Resample to per-minute or per-day numpy arrays:
(N days x 1440 minutes) for
steps,sleep, andbpm(N days) for
weight,rhr, andhrv
Installation
pip install mhealthdata
Quick start
Assume we have Fitbit data export .zip downloaded to folder /Users/username/Downloads/wearable_data/ and unzipped into a subfolder /Users/username/Downloads/wearable_data/User/ with lots of .xml, .csv, .json and sub-folders inside.
Load data:
import mhealthdata

path = '/Users/username/Downloads/wearable_data/User/'
wdata = mhealthdata.FitbitLoader(path)
Use
SHealthLoader()for loading Samsung Health exportUse
HealthkitLoader()for loading Apple Health export
Show loaded data:
print(wdata.dataframes)
print(wdata.df['steps'].head())
Data Analysis and Visualization
Convert data to numpy arrays:
data = wdata.get_device_data()
By default
mhealthdatatruncatessteps/min,heart rate/, andweightin [kg] to physically meaningful range0 - 255.See valid device list:
wdata.devicesGet numpy arrays for specific device e.g.
data = wdata.get_device_data('iPhone')
Date range:
from datetime import datetime

idates = data['idate'] # ordinal days (January 1st of year 1 - is day 1)
dates = [datetime.fromordinal(d) for d in idates]
print(f'Date range {dates[0]} - {dates[-1]}')
Plot one day of data:
import pylab as plt

i = 9 # Day 10 has index 9
plt.figure(figsize=(12,6), facecolor='white')
plt.title(f'Date {dates[i].strftime("%Y-%m-%d")}')
for dname in ['sleep', 'bpm', 'steps']:
                plt.plot(data[dname][i], label=dname)
plt.legend()
plt.show()
Zero values indicate missing data (also not walking and not sleeping for
stepsandsleep)By default
mhealthdatapads data with zeros to match full weeks (Monday through Sunday), so some days at the beginning and at the end may be empty
Data correlations:
from scipy.stats import pearsonr

x = data['rhr']
y = data['weight']

# IMPORTANT: zero values indicate missing data and should be disregarded
mask = (x > 0) & (y > 0)
r, p = pearsonr(x[mask], y[mask])
print(f'Correlation {r:.2f}, P-value {p:.2g}')
Missing data are a certaing problem in wearable data analysis
A study Pyrkov T.V. et al., Nat Comms 12, 2765 (2021) shows high consistency of recovery rates in quite different biological signals - physical activity measured by consumer wearable devices and laboratory blood cell counts. The typical recovery time of 1-2 weeks. The finding suggests it may be safe to use averaging windows or impute data gaps of several day length (though both affect noise and correlation and therefore should be used with caution).
Documentation
Loading data
Examples
Utility functions
- Utility functions
combine_arrays()to_1darray()to_2darray()anomaly_detection()calc_cadence()calc_covariance()calc_interpolation()columns_to_datetime()defragment_sleep()fill_gaps()find_columns_by_key()find_intervals()from_ordinal()histogram_peaks()impute_bpm()series_peaks()sleep_stage_dict()smoother()timezone_txt_to_minutes()to_month_abbr()to_month_name()to_ordinal()to_ordinal_day()to_ordinal_month()to_ordinal_week()to_ordinal_year()to_range()to_weekdayiso()to_weekdayiso_abbr()to_weekdayiso_name()to_year_month_day()unique_sorted()window_avg_std()window_boxcar()window_sigmoid()xticks_dates()xticks_days()xticks_hours()find_timezone_mismatch()fix_timezone_mismatch()